What is a linked Excel chart in PowerPoint (and why does it matter)?
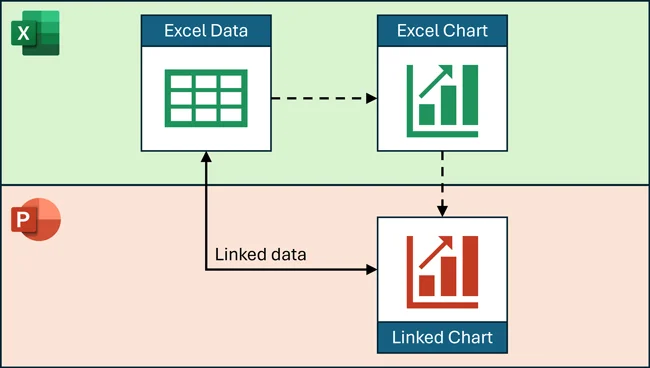
A linked chart is simply a PowerPoint chart that references an external Excel spreadsheet as its data source.
This allows you to use your financial model (or other external Excel spreadsheet), to create and update your PowerPoint charts. The problem is, these types of charts are easily broken.
What is a linked chart in PowerPoint?
Linked charts are great if you know what you are doing, but they can also drive you nuts if your colleagues are linking them by accident.
NOTE: If you want to stand head and shoulders above your colleagues in PowerPoint, grab a PowerPoint Pro Membership here today to get 24/7 access to all my best PowerPoint training courses that will radically improve your PPT skills. Its only $37/month to join, and you can cancel at anytime.
How to link an Excel chart to PowerPoint
To create a linked chart in PowerPoint, you need to first start in Microsoft Excel, then move to PowerPoint. You cannot start in PowerPoint to create a linked chart.
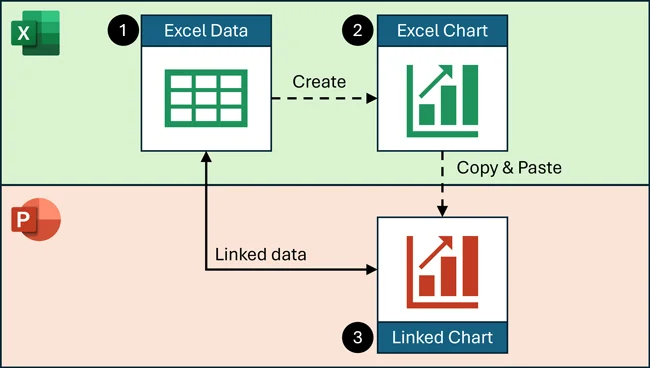
To create a linked chart in PowerPoint, simply:
- Create a data range in Excel to chart
- Create a chart for your data inside of Excel
- Copy and paste that Excel chart into PowerPoint
As you copy and paste the Excel chart into PowerPoint, PowerPoint automatially creates a link back to the Excel spreadsheet’s data. As that Excel spreadsheet is now updated, so will chart in PowerPOint be updated.
As far as chart formatting, you have two options as you paste your chart into PowerPoint.
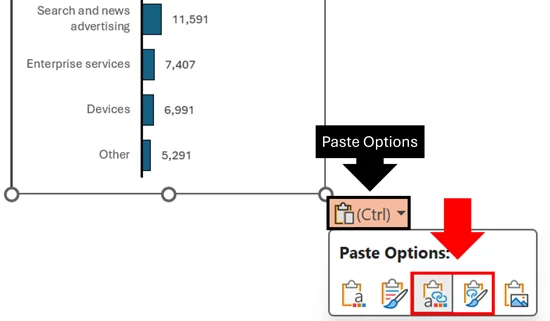
To see these formatting options, simply click the Paste Options command in teh lower right-hand corner of your chart. The two linked options are:
- Use destination theme and link data: Which uses your PowerPoint theme to format the chart.
- Keep source formatting and link data: Which uses your Excel chart formatting to format the chart.
These are NOT linked charts in PowerPoint
Where do professionals get confused with their linked charts? It has to do with Excel.
So to be clear, all PowerPoint charts use an Excel spreadsheet as their data source for their numbers. That includes charts created in Microsoft PowerPoint.
The difference between a PowerPoint chart and a linked PowerPoint chart is where that Excel spreadsheet exists.
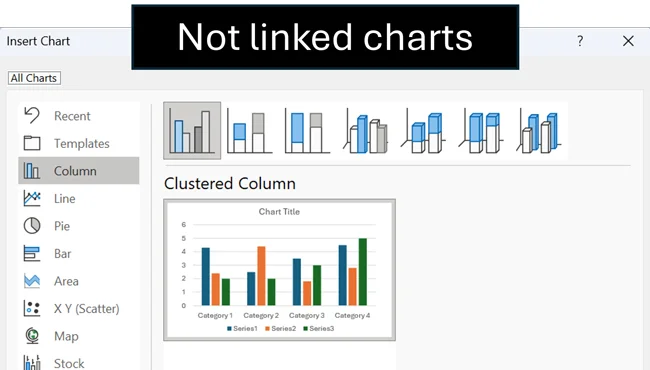
While any chart inserted into PowerPoint using the Insert Chart dialog box has an Excel spreadsheet behind it, those Excel spreadsheets exist within your PowerPoint presentation. They are not external Excel spreadsheets.
How to tell if a PowerPoint chart is linked to Excel?
As most people do not understand that copying and pasting charts between thier Excel spreadsheets and their PowerPoint presentatins creates a linked chart, it is common to run into linked charts.
A fast way to see if a PowerPoint chart is linked is to open its data source.
- Right-click your chart in PowerPoint
- Select Edit data
- Look a the top of the Excel spreadsheet that opens
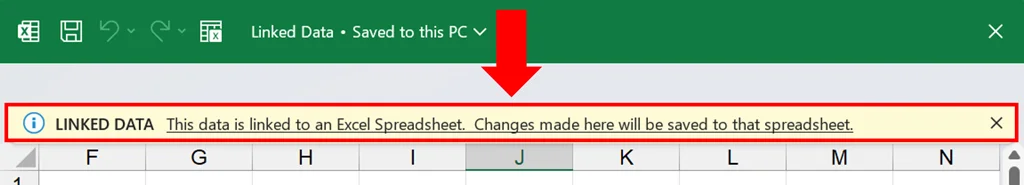
If the chart is linked, you will get the following warning:
LINKED DATA This data is linked to an Excel Spreadsheet. Changes made here will be saved to that spreadsheet.
This means that any changes you make within the Excel spreadhseet, are saved to the Excel spreadsheet. They again are not saved within your PowerPoint presentation.
Error: The linked file isn't available
If you right click a PowerPoint chart and select Edit Data and recieve the following error message, that means that you have a broken link chart.
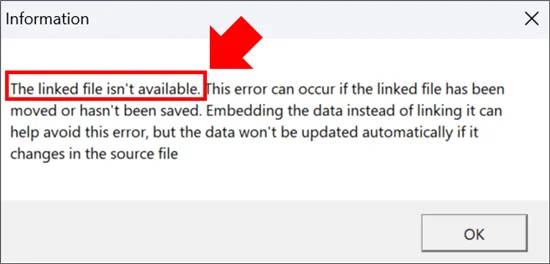
A broken link chart is a linked chart that is no longer properly hooked up to its external data source. To epxand your knowledge and learn how this happens, read my guide here.
Conclusion
Now you know what a linked chart in PowerPoint is, and how easy it is to create one by first starting in Microsoft Excel.
Some teams like to link their charts like this, other teams do not (as it tends to create broken link chart issues). If you are starting a new job, find out what your boss prefers before you start creating a bunch of linked charts in PowerPoint.
If you enjoyed this article and want to learn more about our PowerPoint speed training services and other helpful resources, visit us here.
About the Author

Taylor Croonquist
Co-Founder, Nuts & Bolts Speed Training
Taylor Croonquist is a PowerPoint expert and trainer. Over a career spanning the globe, from consulting in New York and investment banking in China, Taylor has truly seen it all in PowerPoint. Through necessity and a natural tech savvy, Taylor honed his PowerPoint skills to the point of even blowing the minds of the Microsoft PowerPoint programming team. When he's not busy crafting PowerPoint training, you can find him reading a sci-fi series or scuba diving.