In this tutorial, you’ll learn how to create a Venn diagram and format the overlapping pieces, using the Basic Venn Diagram template in Microsoft Office.
This works in Microsoft Word, Excel and PowerPoint.
For help building other kinds of data visualizations in PowerPoint, see our guide here.
What is a Venn Diagram?
Venn diagrams are great for visualizing the relationship between things by highlighting the commonalities, differences and synergies between them.
For example, if you are building a slide and want to highlight that your company is overspending on marketing in ten different states, you could use a Venn diagram to prove it.
Adding the states to your Venn diagram template, you can see the states where you are overspending on marketing as pictured below.
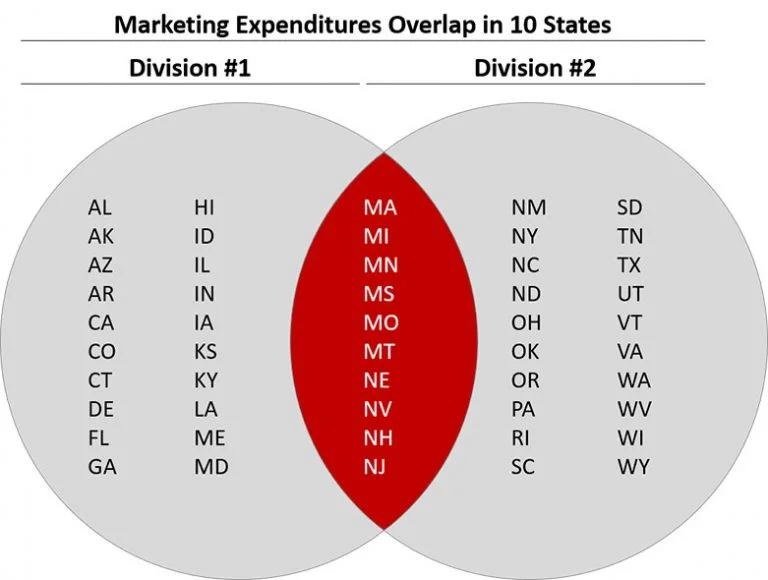
With your data presented like this, it’s easy for your audience to visualize the overlap.
To format the overlapping sections of your Venn Diagram, you’ll need to break it apart (as discussed below), which is slightly different for each version of PowerPoint.
How to create a Venn diagram
In this tutorial, you’ll learn how to create a Venn diagram and format the overlapping pieces, using the Basic Venn Diagram template
1. Open the SmartArt dialog box
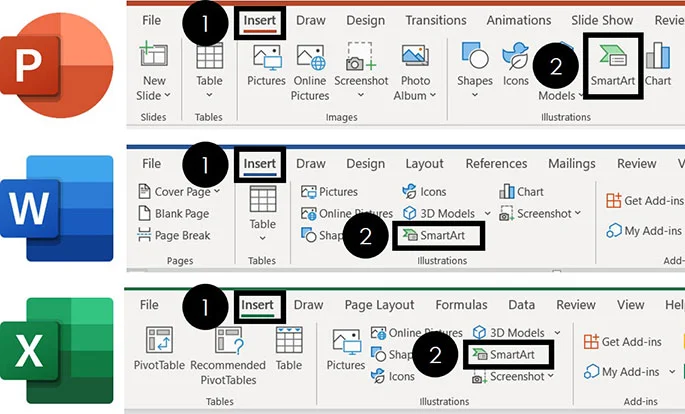
To open the SmartArt dialog box in Word, Excel or PowerPoint, simply:
- Navigate to the Insert tab
- Select the SmartArt command
The SmartArt dialog box is where you’ll find a variety of different graphics you can use in your documents like the blank Venn Diagram graphic.
2. Find the basic Venn graphic
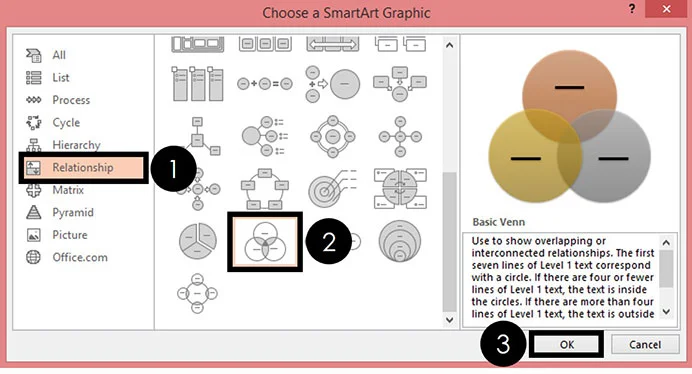
Inside the Choose a SmartArt Graphic dialog box, simply:
- Navigate to the Relationship group on the left
- Scroll down and select the Basic Venn SmarArt graphic
- Click OK
Clicking OK inserts a blank Venn Diagram onto your PowerPoint slide (or other Microsoft Office document). By default your Venn diagram should start with the text dialog box on the left of the diagram open. If you don’t see it, click the little arrow on the left side of your diagram to open the text window.
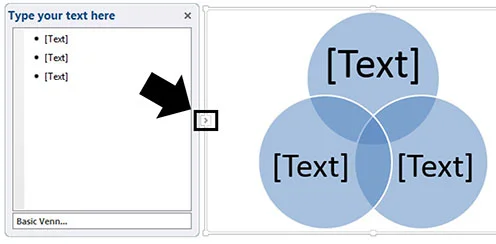
4. Add your text to your Venn diagram
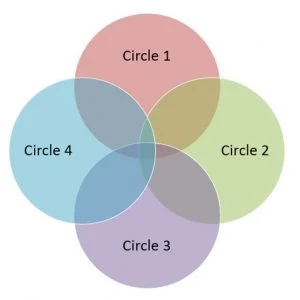
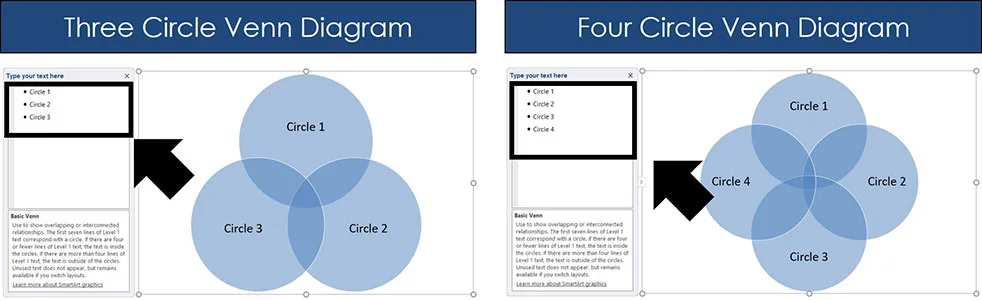
In the text dialog box on the left you can either type text or simply hit enter to add as many circles to your Venn diagram as you like (SmartArt makes this easy).
Using the SmartArt template you can quickly create a 3 part, 4 part of even 10 part Venn diagram in just a couple of minutes.
Venn Diagram Tip: If you are going to continue on and break out the overlapping pieces of the Venn diagram, it’s best not to include any text in the graphic at this point, as it will wonk out when we use the Fragment Tool in a minute.
5. Apply your Venn diagram formatting
Before you break your Venn diagram apart in the next section, you can quickly format your Venn Diagram using the built in Change Color options.
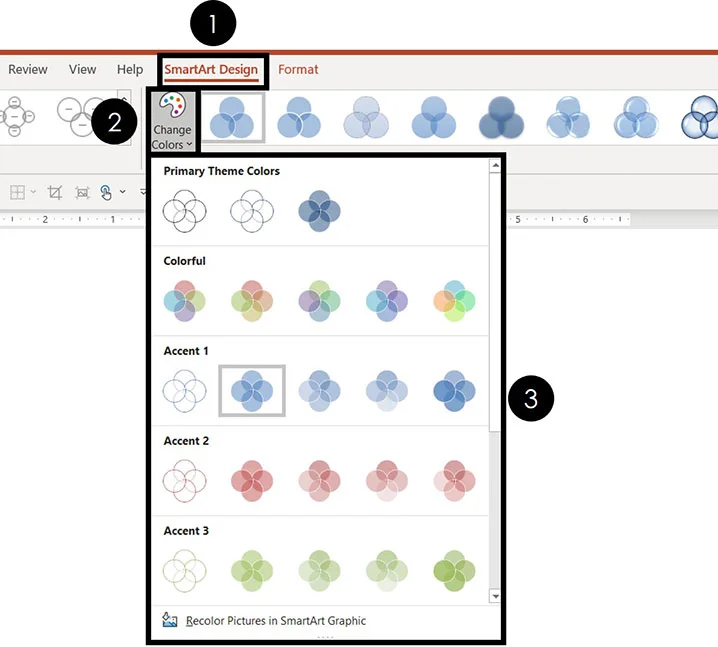
With your Venn Diagram selected, to use the pre-built color schemes, simply:
- Navigate to the SmartArt Design tab
- Open the Change Colors drop down
- Select the color scheme you want
If you select a color scheme that you don’t like, you can continue to use the Change Colors drop down to flip your color scheme before you break your SmartArt graphic apart in the next section.
Formatting The Venn Diagram Overlapping Circles
There are a variety of ways to break out the overlapping pieces of a Venn diagram depending on which version of PowerPoint you have.
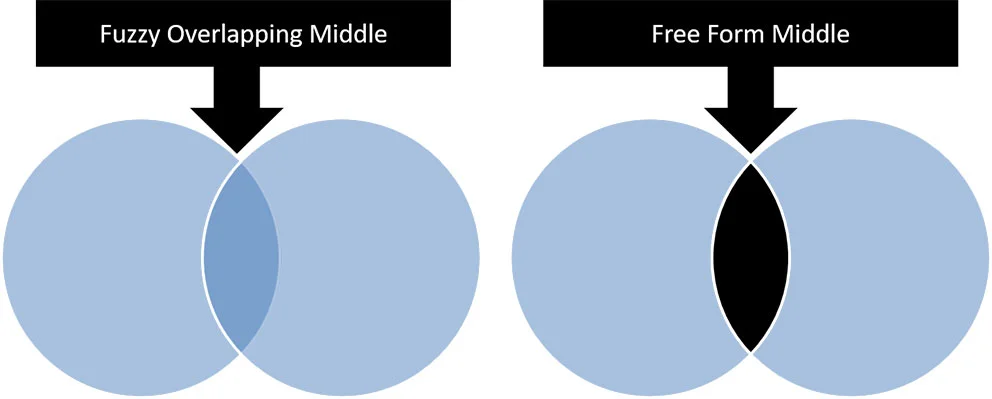
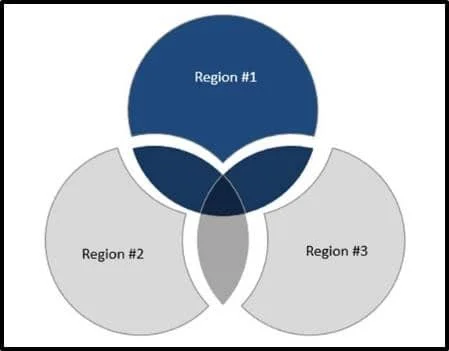
The reason that you need to break them apart to properly format them, is to create the individual shapes, instead of just having the hazzy overlapping circles as pictured below.
Find your version of PowerPoint below to see how to best do this. Anything version of PowerPoint 2013 and later can use the PowerPoint (Office 365) tutorial.
PowerPoint (Office 365): Formatting the overlapping circles of a Venn diagram
After you create your Venn diagram using the latest version of PowerPoint, the next thing you’ll probably want to do is format the overlapping pieces of your Venn diagram.
If you have the latest version of PowerPoint, this is now extremely easy using the fragment tool.1. Ungroup your SmartArt graphic
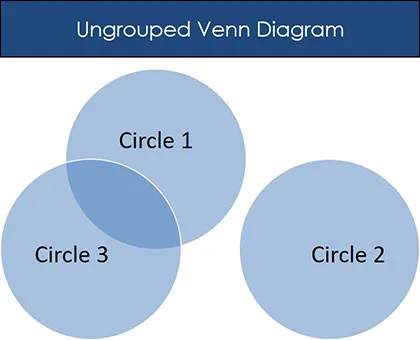
To ungroup your Venn diagram graphic, simply select it and hit Ctrl + Shift + G on your keyboard tw+ice.
Doing so leaves leaves you with just the three overlapping circles of the SmartArt graphic. In the picture above I’ve moved one of the circles to the right to prove that they are just circles now (nothing fancy here).
Note: To learn about all the different things you can group and ungroup in PowerPoint (like SmartArt), read our guide here.
2. Use the fragment tool to break out the overlapping pieces
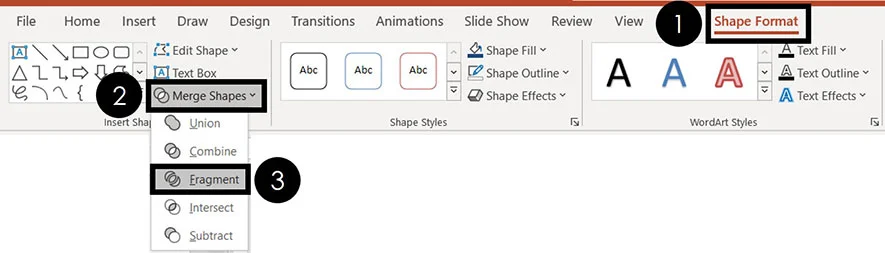
With your Venn diagram circles selected, to fragment them apart simply.
- Navigate to the Shape Format tab
- Open the Merge Shapes drop down
- Select the Fragment command
If you have a three circle Venn diagram, Fragmenting the circles leaves you with seven individual pieces that you can now individually format as pictured below.
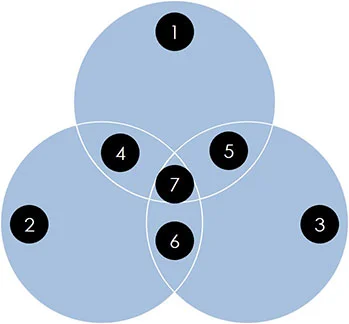
If you start with more than three circles in your Venn diagram, you will end up with more pieces that I did in the picture above.
Important Note: The Fragment Tool only exists in PowerPoint 2013 and later (including the Office 365 subscription).
If you have an earlier version of PowerPoint, you can learn how to format the overlapping pieces of your Venn diagram in below.
If you want to upgrade to the latest version of PowerPoint (Microsoft 365), see Microsoft’s website here.
3. Remove the 50% transparency
With the pieces all broken out, next you’ll want to remove the 50% transparency that carried over from SmartArt graphic so that you can format the overlapping pieces anyway you like.
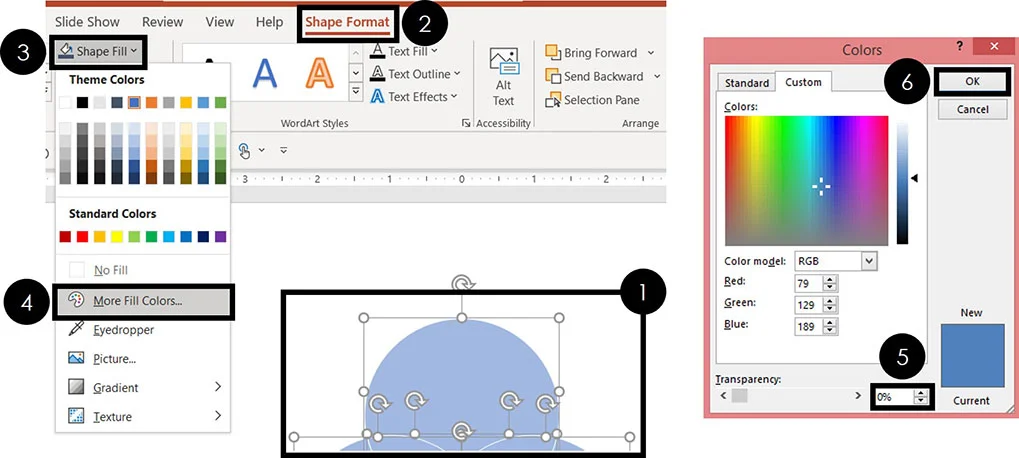
To remove the 50% transparency from your PowerPoint shapes, simply:
- Select all the pieces of your Venn Diagram
- Navigate to the Shapes Format tab
- Open the Shape Fill drop down
- Select More Fill Colors
- Adjust the Transparency to 0%
- Select OK
This removes the 50% transparency grading that automatically comes with the Basic Venn Diagram graphic in Microsoft Office. Doing so, allows you to format the graphic any way you see fit.
4. Format and customize your Venn diagram to meet your needs
With the transparency removed, you can now freely format the graphic any way you like and/or type text directly into any of the pieces of the diagram (or add a text box on top of the diagram so you don’t have to mess around with the interior margins)…
That’s the beauty of breaking out the overlapping pieces of a Venn diagram!
PowerPoint 2010: Formatting the Overlapping Circles of a Venn Diagram
So if (and only if) you use lots of Venn diagrams in your presentations, I highly recommend upgrading to the latest version of PowerPoint (the Office 365 subscription), as it takes less than 30 seconds to break a Venn diagram apart (regardless of how complicated the graphic is) with the new fragment tool.
Also, don’t forget, if you are you using the Basic Venn SmartArt template, you need to first break the graphic apart before you can format the overlapping circles.
The fastest way to break a SmartArt graphic apart, is to use the Ungroup Shortcut twice (Ctrl + Shift + G). To learn more about what you can and can’t group and ungroup in PowerPoint, read our guide here.
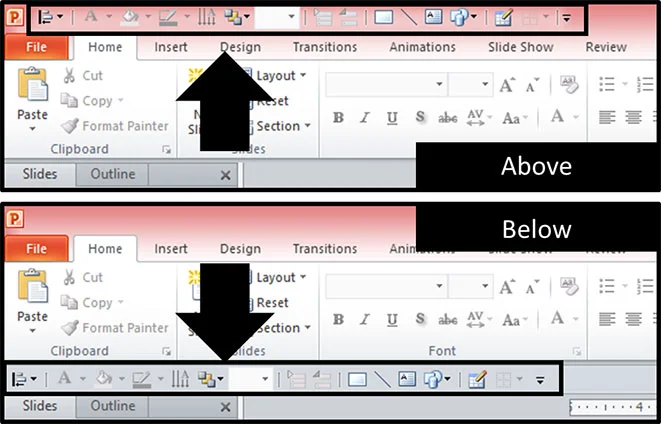
1. Find your Quick Access Toolbar
Find your Quick Access Toolbar, which is either directly above or directly below your Ribbon (see below diagram). This is the only way to get the Combine Shapes tool in PowerPoint 2010. It is now a default feature in the latest versions of PowerPoint.
2. Launch the More Commands dialog box
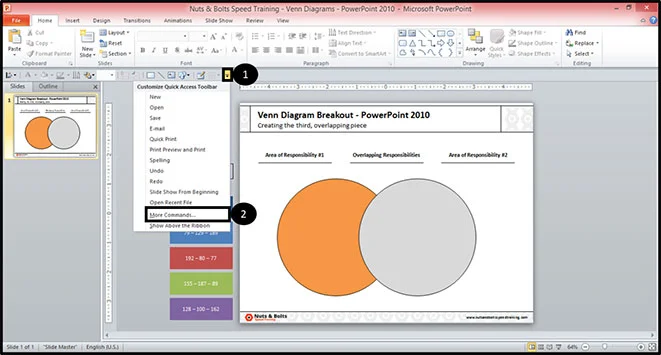
To open the More Commands dialog box, simply:
- Click the Customize Quick Access Toolbar command (the downward facing arrow)
- Select More Commands
The More Commands dialog box is where you can add, remove and rearrange commands on your Quick Access Toolbar (a hidden PowerPoint secret).
3. Add the Combine Shapes tool to your Quick Access Toolba
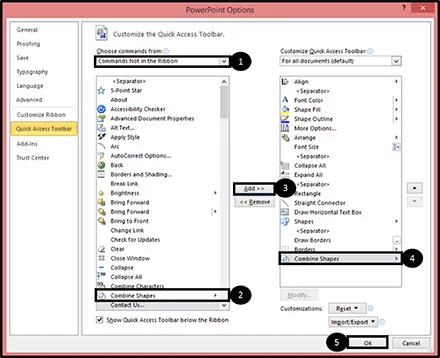
Within the More Commands dialog box:
- Filter the Choose Commands drop down to Commands Not on the Ribbon
- Select the Combine Shapes tool
- Select Add to put in on your Quick Access Toolbar
- Visually confirm that the tool is on your QAT
- Select OK
4. Create duplicates of your slides
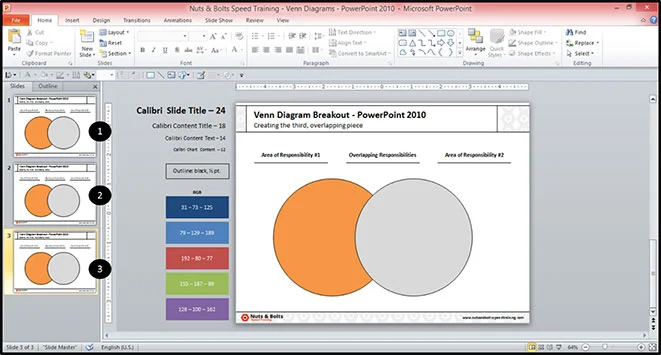
To break out the overlapping pieces in PowerPoint 2010, you will need to duplicate your slide twice (so that you have three of the same slide).
To quickly duplicate your slides in PowerPoint, hit CTRL + SHIFT + D on your keyboard twice, so that in total you have three copies of your slides (as pictured above).
To see a full list of our favorite PowerPoint shortcuts like this, read our guide here.
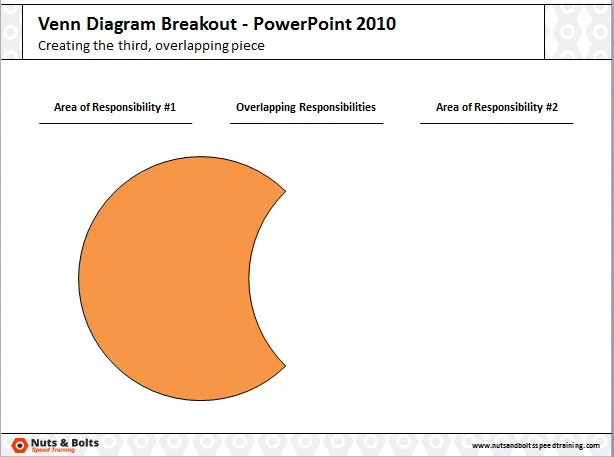
5. Subtract out first piece of your overlapping circles
To break out the overlapping pieces in PowerPoint 2010, you will need to duplicate your slide twice (so that you have three of the same slide).
To quickly duplicate your slides in PowerPoint, hit CTRL + SHIFT + D on your keyboard twice, so that in total you have three copies of your slides (as pictured above).
5. Subtract out first piece of your overlapping circles
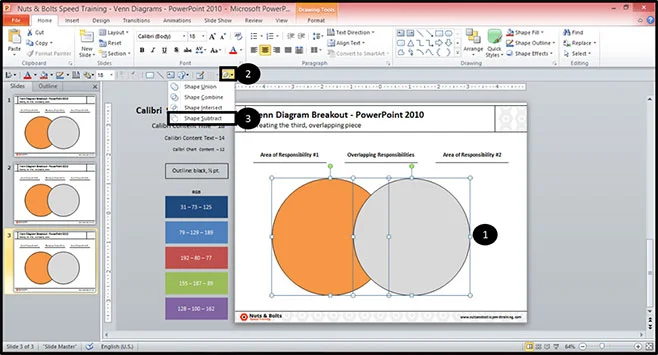
To breakout the first piece of your Venn Diagram with the Subtract Tool:
- First select the Grey circle then select the Orange circle (the order is important)
- Open the Combine Shapes tool on your Quick Access Toolbar
- Select Shape Subtract
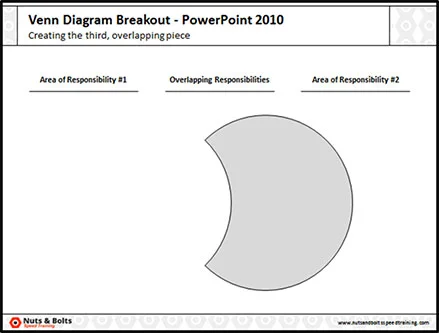
Doing so, you are left with the first piece of your Venn Diagram but out so that you can format it anyway you like.
Note: When using the Subtract tool, you always want to first select the PowerPoint shape that you want to keep, and then select the PowerPoint shape you want to subtract from it.
6. Subtract out the second piece of your Venn diagram
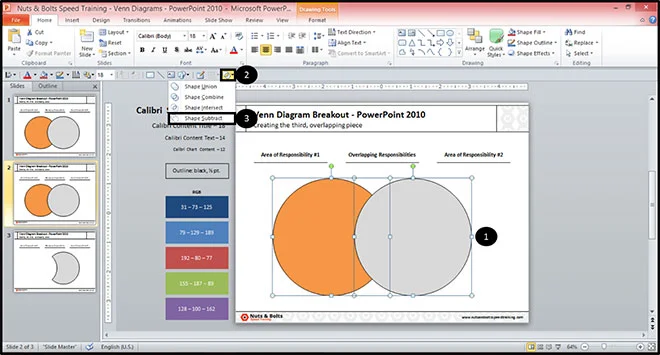
On your second slide do the same thing but in the reverse order.
- First select the Orange circle then select the Grey circle (the order is important)
- Open the Combine Shapes tool on your Quick Access Toolbar
- Select Shape Subtract
next slide, you want to do the same thing, except select the shapes in the reverse order. So first select the orange circle, then the grey circle and from the Combine Shapes tool, select Subtract.
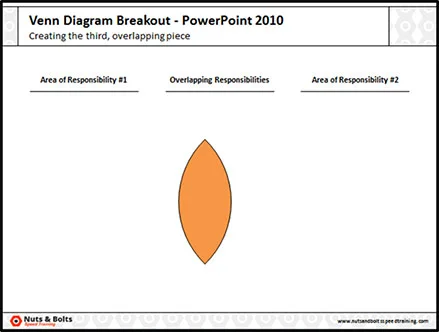
7. Use the Intersect command on the third piece
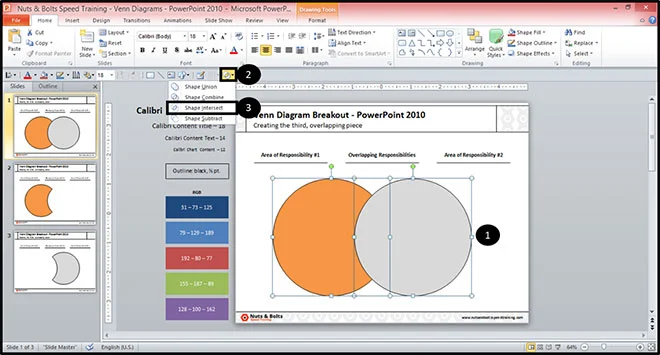
On your third slide, to breakout the middle piece of your Venn diagram:
- Holding Shift, select both the Orange and Grey circle
- Open the Combine Shapes tool on your Quick Access Toolbar
- Select Shape Intersect
Using the Shape Intersect command leaves you with just the overlapping pieces of your diagram, in this case the center piece.
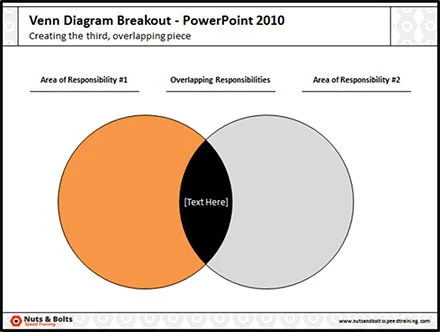
8. Collect all of your Venn Diagram pieces on one slide
With all of your Venn diagram pieces now broken out, simply copy and paste the pieces onto a single slide and delete all of the duplicate slides.
With all the individual pieces now cut out, you can now format the pieces anyway you like, just as you normally would in PowerPoint.
PowerPoint 2007: Formatting the Overlapping Circles of a Venn Diagram
If you have PowerPoint 2007, take a deep breath and relax…
Creating the center piece of a Venn diagram in PowerPoint 2007 is fairly painful, as you have to use the “edit points” method as described below, and it only really works for very simple Venn diagrams.
As you increase the number of overlapping objects in your graphic, using PowerPoint 2007, the center shape becomes increasingly more difficult and time-consuming to create (if not impossible).
Think about upgrading to the latest version of PowerPoint.
If you frequently need to do this, I highly recommend upgrading to the latest version of PowerPoint as it takes less than 30 seconds to pull off with the new fragment tool (good job Microsoft!), regardless of how complicated your graphic is.
Don’t forget that if you use the SmartArt Basic Venn diagram template, you’ll fist need to ungroup it twice (Ctrl + Shift + G) before you can follow along with the steps below.
1. Take away the shape fill color of your graphic
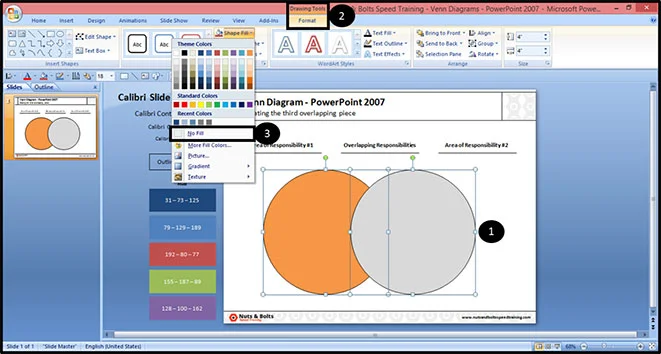
To remove the shape fill from your overlapping circles:
- Select your Venn diagram circles
- Navigate to the Drawing Tools Format tab
- From the Shape Fill, select No Fill
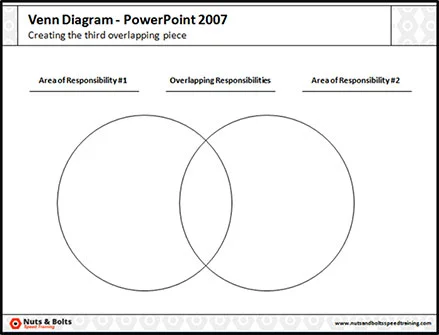
With the shape fills gone, you can now see exactly where we need to create the new shape for your Venn diagram.
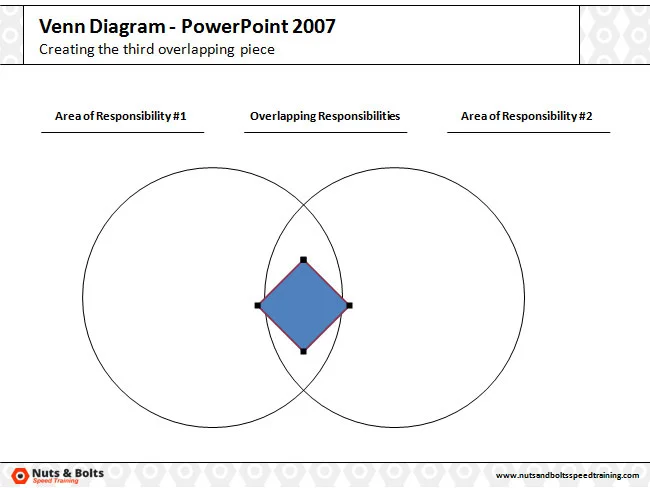
2. Insert a square into the center of the graphic
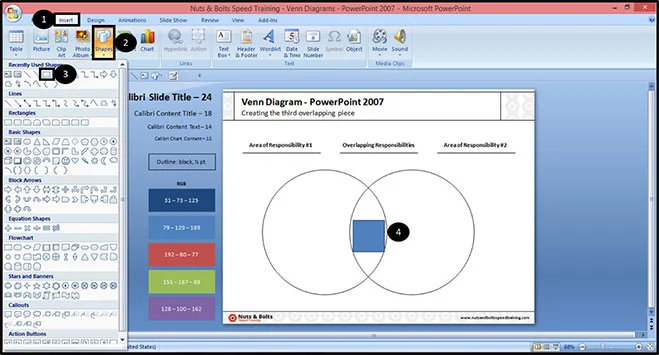
To insert a perfect square in the middle of your Venn diagram, simply:
- Navigate to the Insert tab
- Open the Shapes drop down
- Find a Square
- Draw and position it on your slide
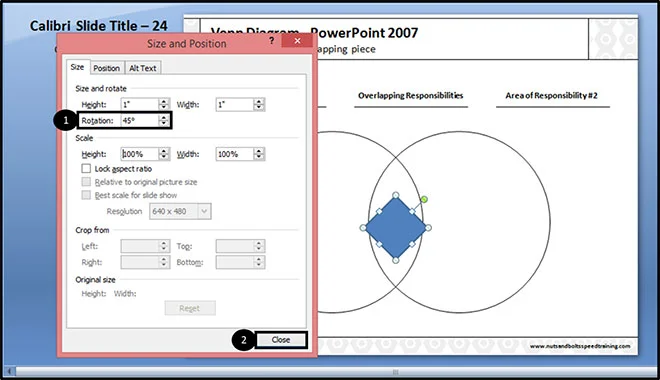
3. Rotate your square 45 degree
Right-click your square and select Size and Position.
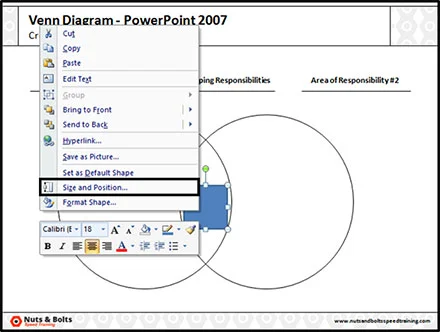
Within the size and position dialog box, change the square’s rotation to 45 degrees, and then close the dialog box.
4. Middle align the square to your overlapping circles
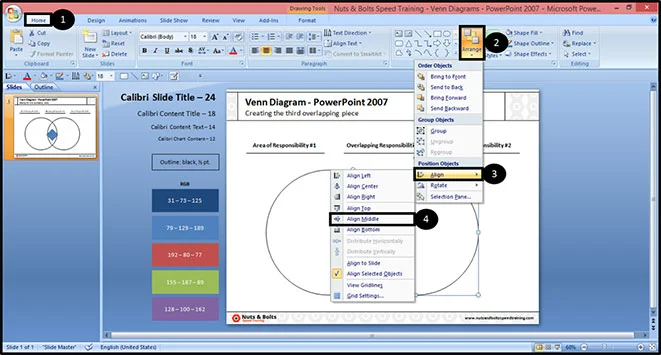
Holding the Shift key on your keyboard, select both the square and one of your circles and then Align to Middle:
- Navigate to the Home tab
- Open the Arrange drop down
- Open the Align command options
- Choose Align Middle
Aligning to the middle ensures that you can correctly recreate the middle overlapping piece in your Venn diagram in PowerPoint 2007.
5. Distribute your square horizontally
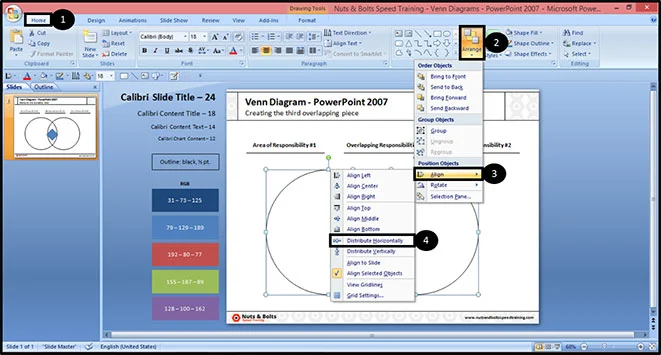
Now select all of your circles and the square and Align to
- Navigate to the Home tab
- Open the Arrange drop down
- Open the Align command options
- Choose Distribute Horizontally
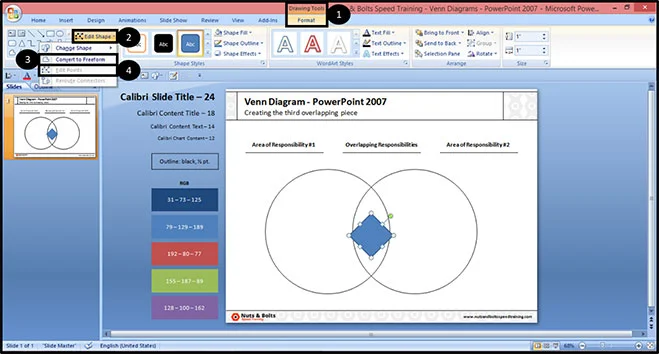
With the square now perfectly aligned in the middle of our shapes (which makes this easier), select the square again and then:
- Select the Drawing Tools Format tab
- Open up the Edit Shapes drop down
- Select (and then re-select the Edit Shapes drop down)
- Re-Select the Edit Shapes drop down and this time select Edit Points
Doing so, you should see a red outline around your square, signifying that you are now in Point Editing Mode.
7. Manually adjust the ends of the square into position
Grab the points and stretch them out to reach the top, bottom, left and right of the middle area (this is EXTREMELY painful). If you need to do this a lot, I highly recommend upgrading to the latest version of PowerPoint.
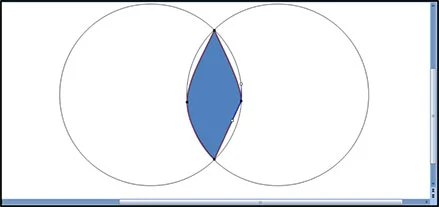
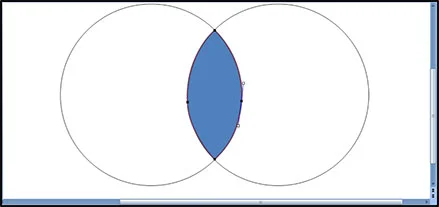
8. Use the handle bars to mold the shape
Selecting one of the points, notice that there are white handle bars that appear. You can use these to adjust and warp the edges of the shape.
Using the handlebars of the right and left points, warp the edges of the square until it fits perfectly the middle area of the Venn diagram.
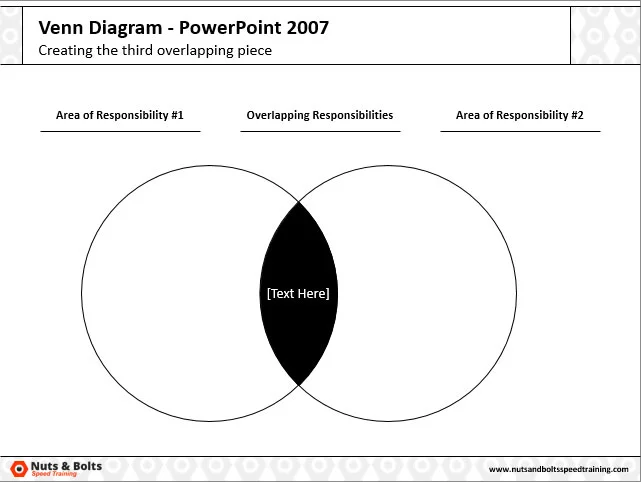
9. Format the center part of the Venn diagram
With the new shape created, you can now color it and type text into the middle part of your Venn diagram.
Troubleshooting your Venn diagram
Knowing that there is a Combine Shapes tool in PowerPoint 2010 and a Merge Shapes tool in PowerPoint 2013, it’s important to keep in mind that if you add the 2013 command to your QAT, and then open PowerPoint 2010 on your computer, the command will disappear.
Why?
Because PowerPoint 2010 doesn’t recognize the 2013 command. So you’ll need to either find a version of 2013 to use, or go and add the Combine Shapes tool to your QAT.
In the opposite scenario, if you add the PowerPoint 2010 Combine Shapes tool to your QAT and then open PowerPoint 2013 on your computer, the Combine Shapes tool will remain on your QAT, but it will not have the added features of the Merge Shapes tool. So if you want the Merge Shapes tool on your QAT, you need to add it specifically using 2013.
Closing thoughts
So that’s how to create a Venn diagram in PowerPoint, and how to use the new fragment tool to break the overlapping pieces apart so that you can format them anyway you like.
As you can see, the new SmartArt features and Merge Shapes tools make creating these types of graphics extremely easy (and why it’s worth upgrading to the latest version of PowerPoint).
If you enjoyed the depth of this tutorial, covering all versions of PowerPoint, you will LOVE our PowerPoint training courses which you can learn more about here.
What’s Next?
About the Author

Taylor Croonquist
Co-Founder, Nuts & Bolts Speed Training
Taylor Croonquist is a PowerPoint expert and trainer. Over a career spanning the globe, from consulting in New York and investment banking in China, Taylor has truly seen it all in PowerPoint. Through necessity and a natural tech savvy, Taylor honed his PowerPoint skills to the point of even blowing the minds of the Microsoft PowerPoint programming team. When he's not busy crafting PowerPoint training, you can find him reading a sci-fi series or scuba diving.