There are a variety of ways to break out the overlapping pieces of a Venn diagram in PowerPoint (all described below)…
…but before you dig into ANY of these tutorials, I need to ask:
Are you using SmartArt to build your Venn diagram?
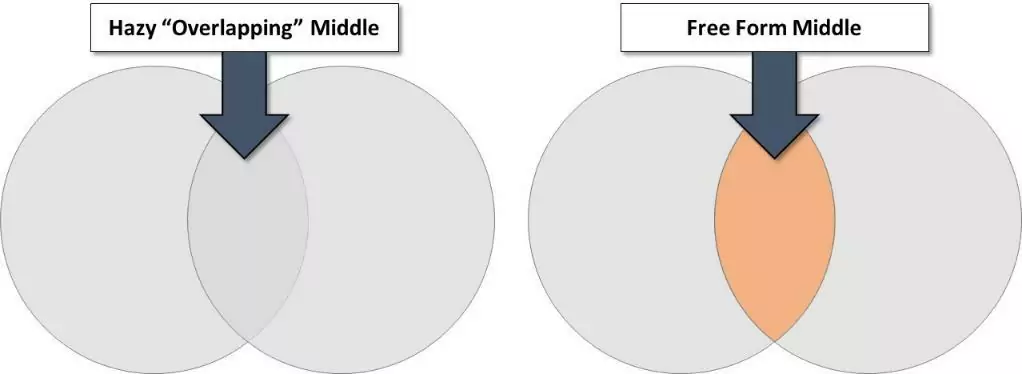
If so, you first need to break your SmartArt graphic before continuing on with these tutorials…otherwise you’ll be stuck with a “fuzzy” overlapping middle piece which is not what you want.
To break your Venn Diagram SmartArt graphic apart, simply hit CTRL + SHIFT + G twice on your keyboard.
For help with the group and ungrouping shortcuts, see top shortcuts #5 and #6 in the below video.
You are currently viewing a placeholder content from Youtube. To access the actual content, click the button below. Please note that doing so will share data with third-party providers.
More InformationIf you need helping using SmartArt to build your Venn diagram (which is significantly faster than doing it manually), see our other post here.
As you probably know, Venn diagrams are great for visualizing the relationship between things by highlighting the commonalities, differences and synergies among them.
For example, if you were building a slide and want to highlight that your company is overspending on marketing in ten different states, you could put your data into a Venn diagram, using the techniques we’ll cover below, to visually highlight your point as follows:

With your data presented like this, it’s easy for your audience to visualize the overlap; which is why being able to break out the middle overlapping part is so important.
Scroll down to find your version of PowerPoint (the methods are radically different), or use the links above to navigate this page.
For help creating other data visualizations (and learn why they are so important to your presentation), see our guide here.

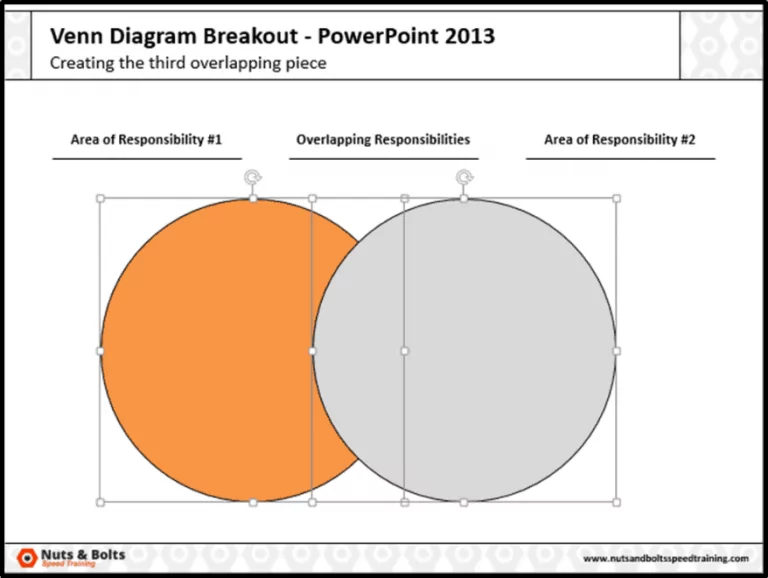
If you have PowerPoint 2013 or later, you are in for a treat!
The new fragment tool makes breaking out the center piece of a Venn diagram EXTREMELY easy (regardless of how complicated your graphic is).
That said, it still won’t work if you’re using a SmartArt graphic… you need to break the graphic apart first. So if you’ve inserted a SmartArt graphic, simply select it and hit Ctrl + Shift + G twice.
With that said, below is both a video guide and written tutorial to help you out.
You are currently viewing a placeholder content from Youtube. To access the actual content, click the button below. Please note that doing so will share data with third-party providers.
More InformationHolding the Shift key on your keyboard, select your shapes (as many as you have) that you want to create the middle portions for.
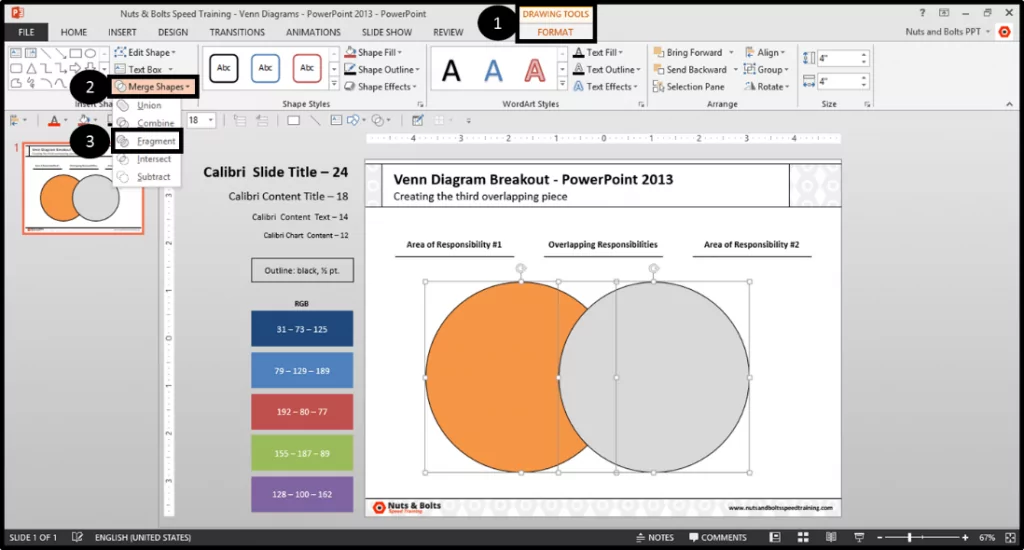
Navigate to the Drawing Tools Format tab, open the Merge Shapes dropdown, and select the Fragment Tool (this is a brand new command introduced in PowerPoint 2013…all of your colleagues will be jealous!)
Here’s what you’ll get after using the Fragment Tool:
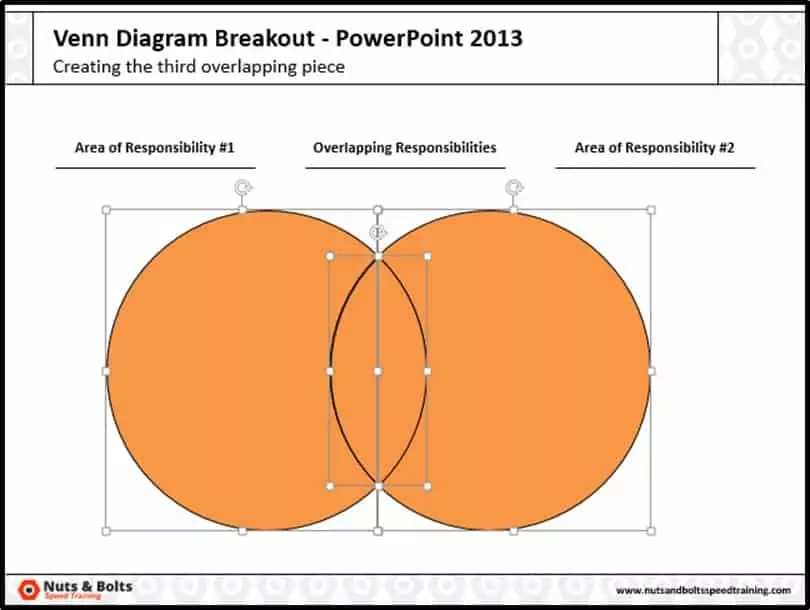
Note: When using the Fragment Tool, the fill color of the shape you select first will be applied to all of the other shapes you use the Fragment Tool on.
So if (and only if) you use lots of Venn diagrams in your presentations, I highly recommend upgrading to PowerPoint 2013, as it takes less than 30 seconds to break a Venn diagram apart (regardless of how complicated the graphic is) with the new fragment tool.
Also, don’t forget, if you are you using a Venn diagram SmartArt graphic, you need to break the graphic before proceeding with this tutorial (otherwise it won’t work).
So if you have a SmartArt graphic, select it and hit Ctrl + Shift + G twice to break the graphic apart before you continue on here.
You are currently viewing a placeholder content from Youtube. To access the actual content, click the button below. Please note that doing so will share data with third-party providers.
More InformationFirst things first, you need to “uncover” the combine shapes tool in PowerPoint 2010 before you can breakout the center piece of a Venn diagram.
The command exists within PowerPoint 2010, but for some reason the developers decided to hide it from you…so first you need to bring it into play.

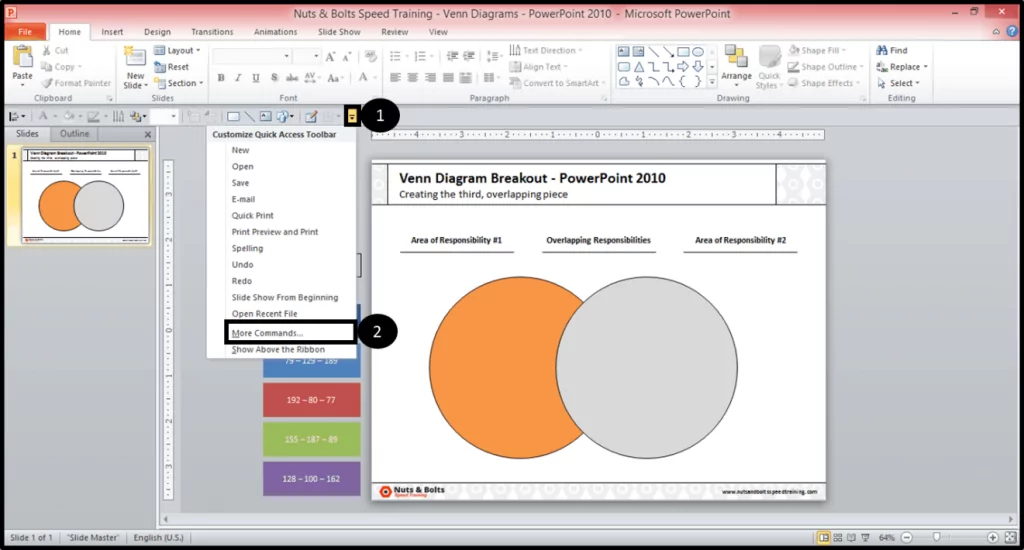
Find your QAT, it is either directly above or directly below your Ribbon (see below diagram).
At the end of your QAT, click the downward facing arrow and from the drop down, select More Commands to launch the More Commands dialog box.
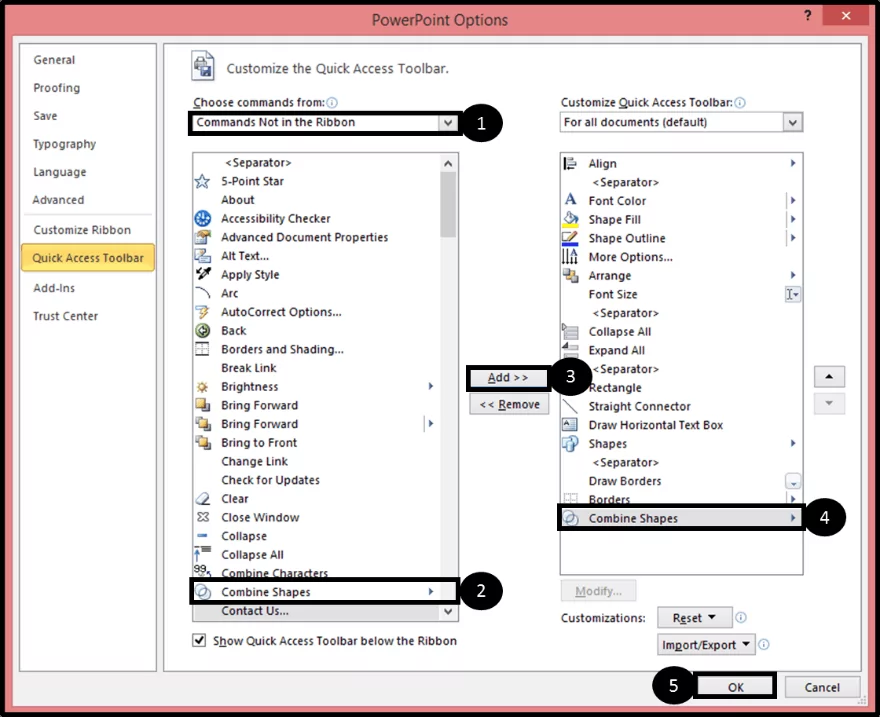
Within the More Commands dialog box:
- Filter the drop down to Commands Not on the Ribbon
- Select the combine shapes tool
- Select Add to put in on your QAT
- Visually confirm that the tool is on your QAT
- Select OK to close the dialog box.
At the end of your QAT, click the downward facing arrow and from the drop down, select More Commands to launch the More Commands dialog box.
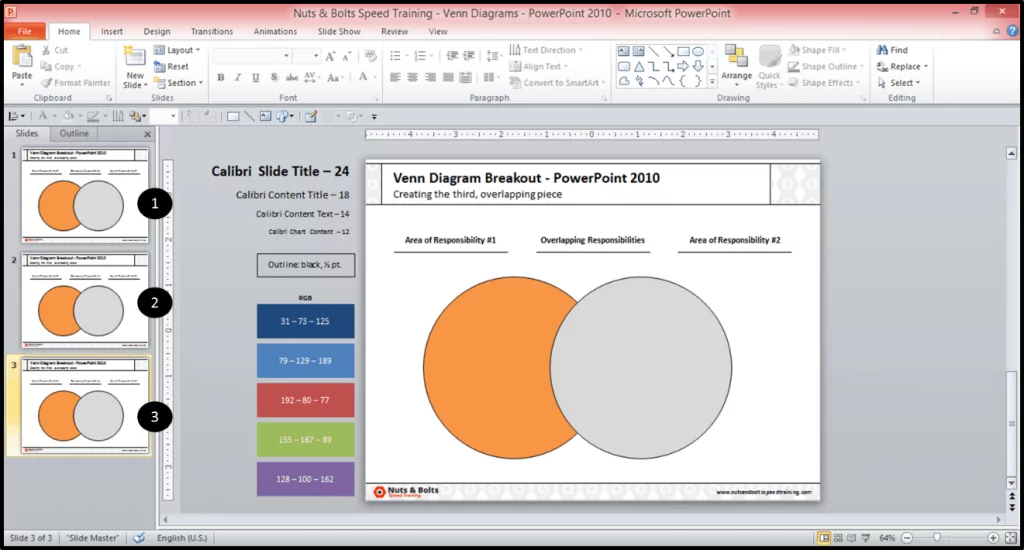
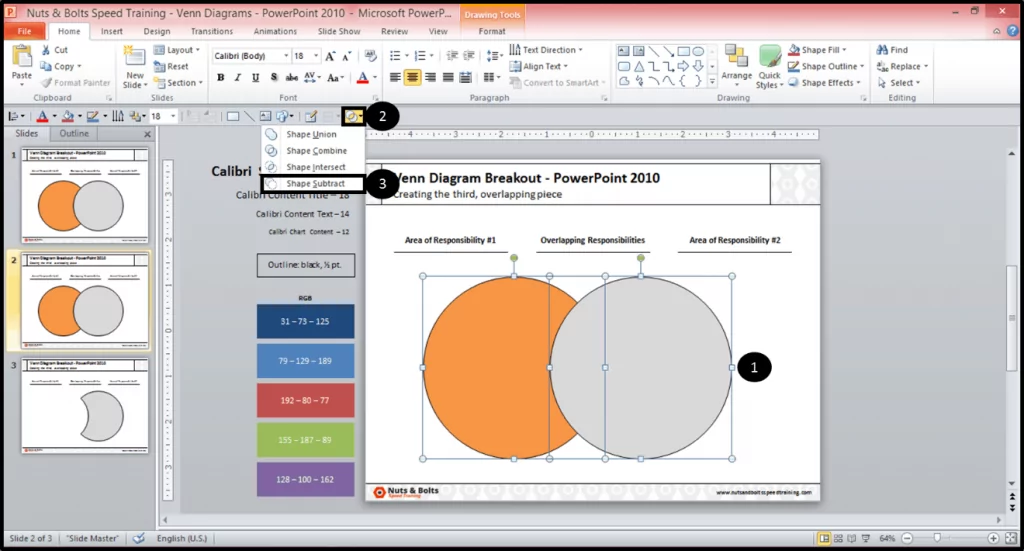
Starting on the third slide, first select the grey circle and then the orange circle.
Then from the Combine Shapes tool on your QAT, select Subtract, which leaves you with just the grey circle, with part of it cut out.
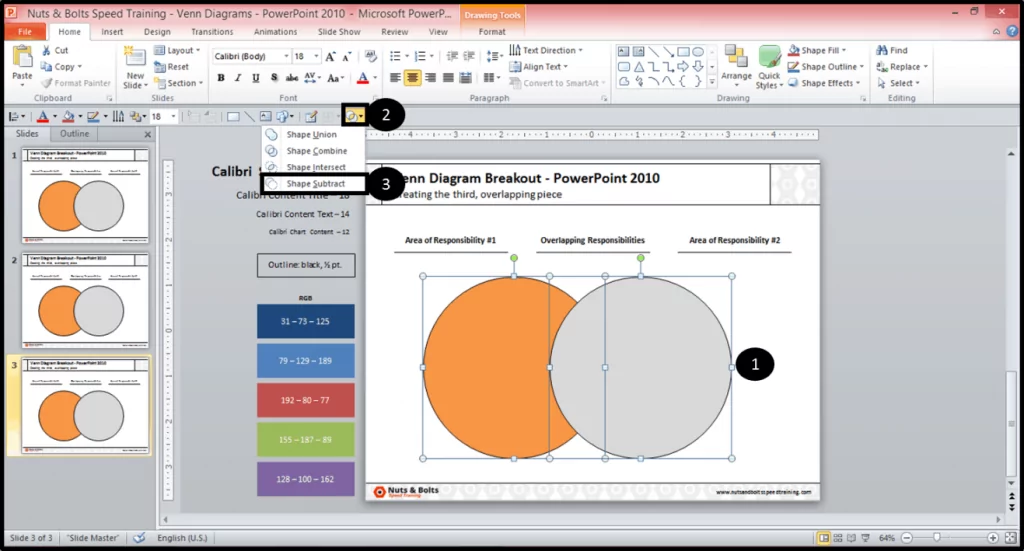
Note: When using the Subtract tool, you always want to first select the PowerPoint shape that you want to keep, and then select the PowerPoint shape you want to subtract from it.
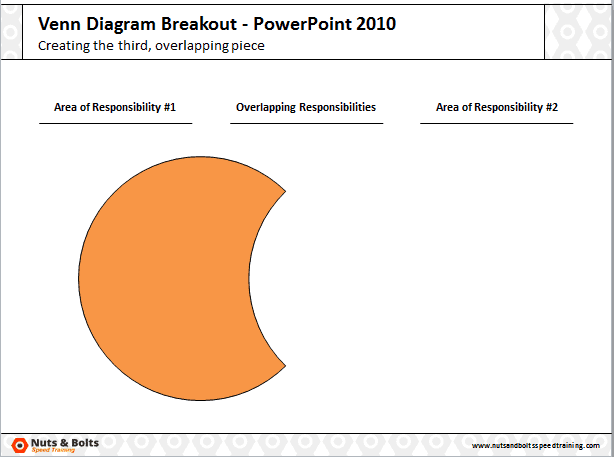
On the next slide, you want to do the same thing, except select the shapes in the reverse order. So first select the orange circle, then the grey circle and from the Combine Shapes tool, select Subtract.
This leaves you with just the orange circle, with part of it cut out.
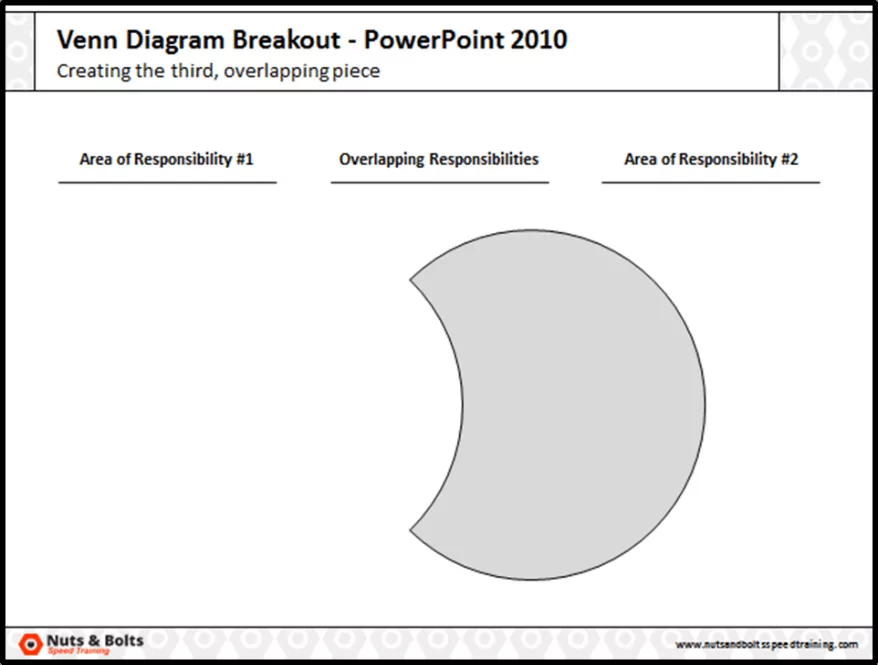
For the middle piece (the last slide), select all of the shapes, but this time, from the Combine Shapes tool select Intersect.
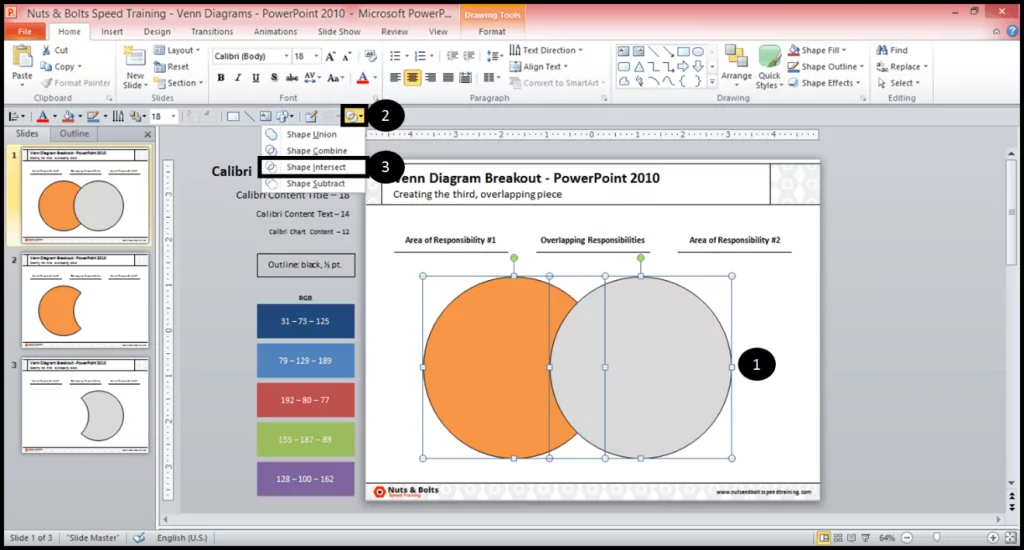
And now you’re left with only the middle piece.

With all of your Venn diagram pieces now broken out, copy and paste your pieces onto a single slide and delete all of your duplicate slides.
With all the pieces collected, you can now add color and type text into the middle piece of your Venn diagram.

Take a deep breath and relax…
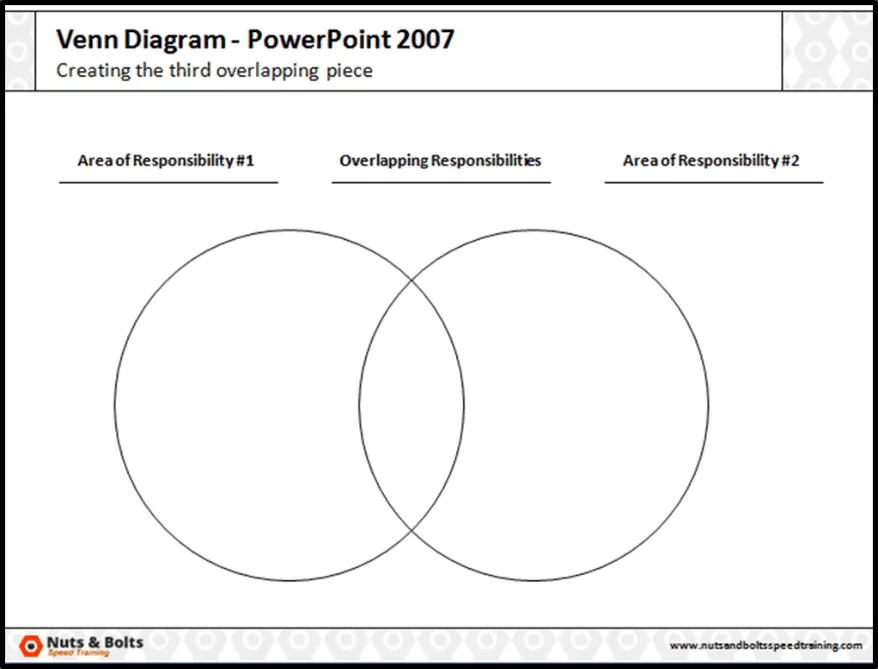
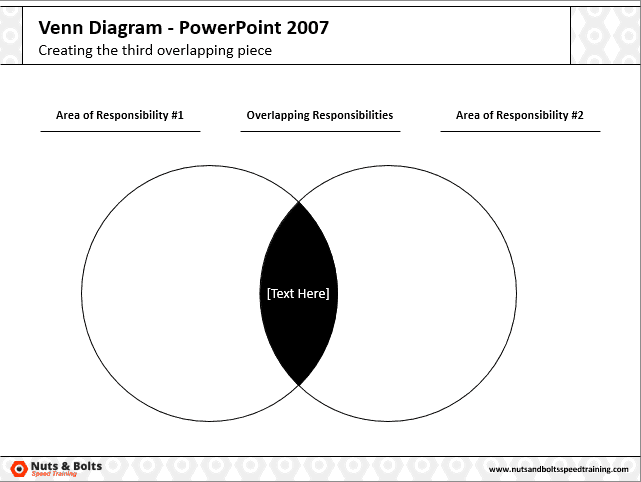
Creating the center piece of a Venn diagram in PowerPoint 2007 is fairly painful, as you have to use the “edit points” method as described below, and it only really works for very simple Venn diagrams.
As you increase the number of overlapping objects in your graphic, using PowerPoint 2007, the center shape becomes increasingly more difficult and time-consuming to create (if not impossible).
Think about upgrading to the latest version of PowerPoint.
If you frequently need to do this, I highly recommend upgrading to the latest version of PowerPoint as it takes less than 30 seconds to pull off with the new fragment tool (good job Microsoft!), regardless of how complicated your graphic is.
Also, if you are using a SmartArt graphic, I still recommend breaking it before trying to pull off the center piece using this method. So if you have a SmartArt graphic, select it and hit Ctrl + Shift + G twice to break it apart.
Below is both a video guide and written tutorial to get you on your way. Also, don’t miss out on the free slides below the video, enjoy!
You are currently viewing a placeholder content from Youtube. To access the actual content, click the button below. Please note that doing so will share data with third-party providers.
More InformationSelect the shapes that you want to create the center piece for, and from the Drawing Tools Format tab, select No Fill.
With the shape fills gone, you can now see exactly where we need to create the new shape for our Venn diagram.
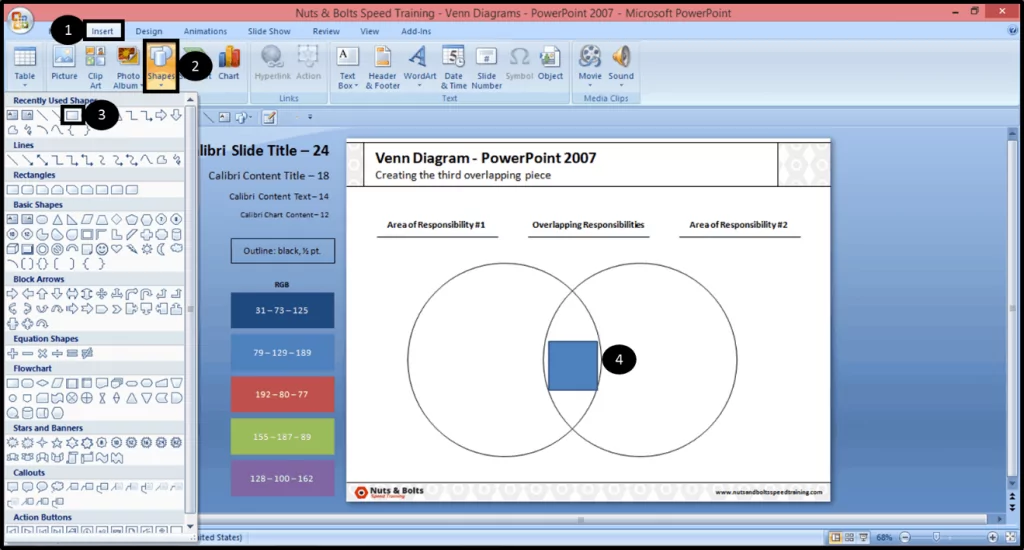
From the Insert Tab on the Ribbon, select a rectangle. Then, position your mouse in the overlapping area of the Venn diagram, and click once to create a perfect square.
- Navigate to the Insert tab
- Open the Shapes drop down
- Find a Square
- Draw and position it on your slide
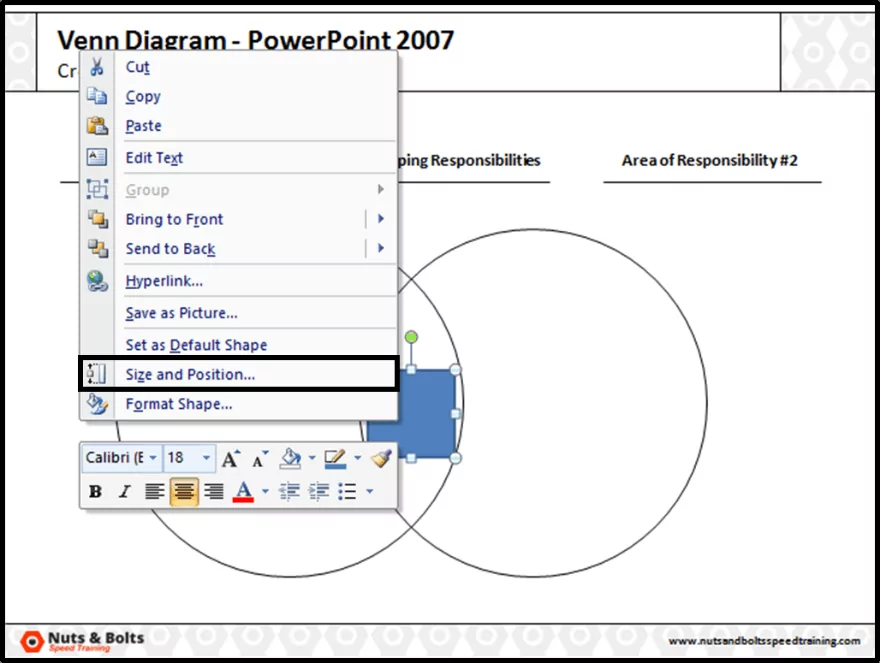
Right-click your square and select Size and Position.
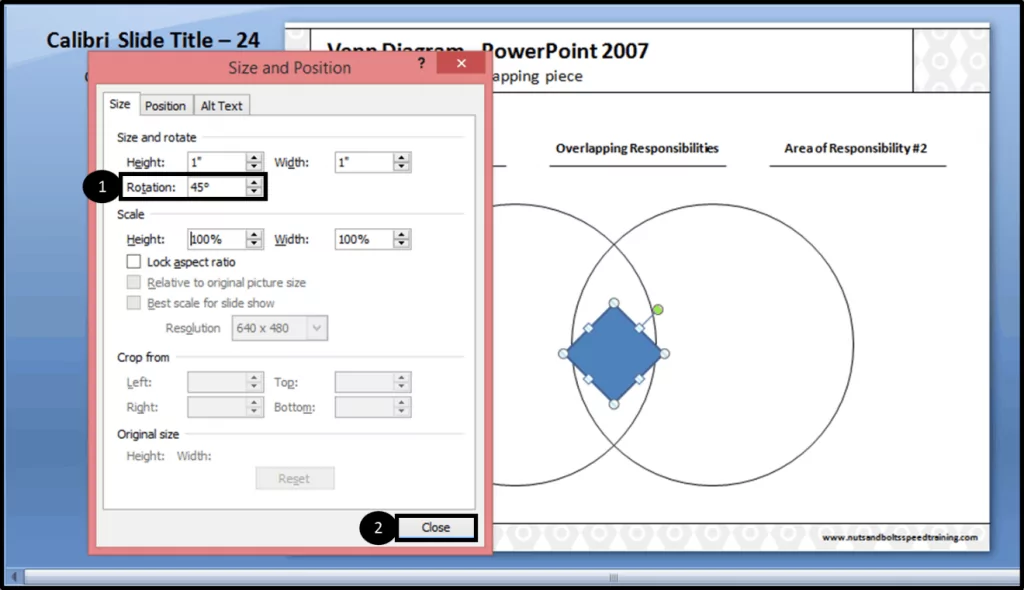
Within the size and position dialog box, change the square’s rotation to 45 degrees, and then close the dialog box.
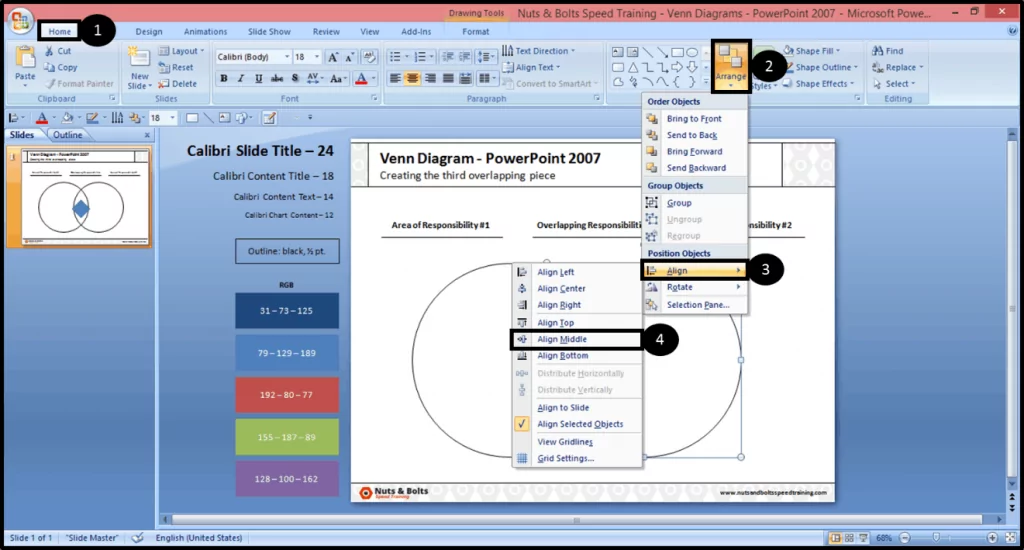
Holding the Shift key on your keyboard, select both the square and one of the circles.
Then from the Home tab, open the arrange tool, find the alignment tool and select Align to Middle.
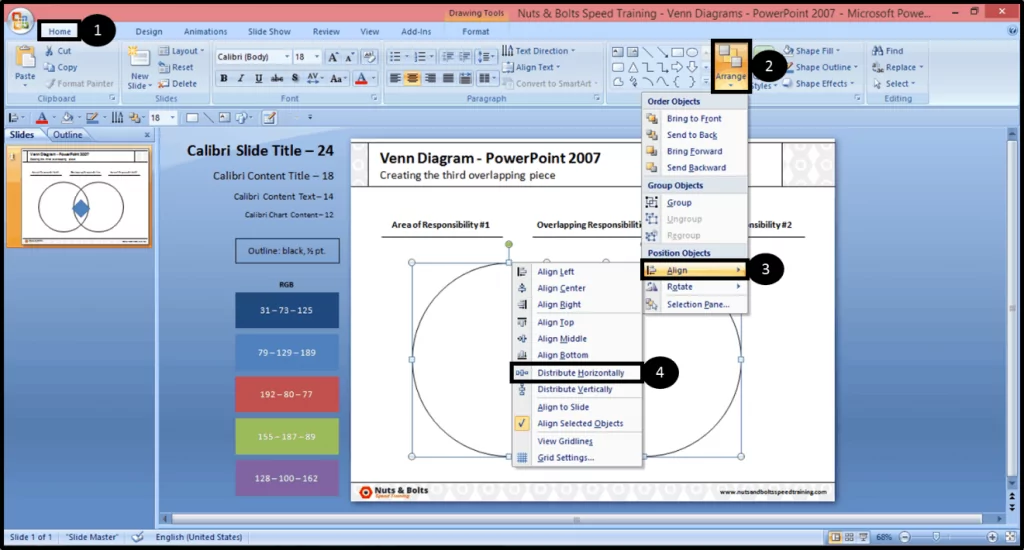
Select both of your circles and the square, and from the Home tab, open the Arrange Tool, find the Alignment Tool and select Distribute Horizontally.
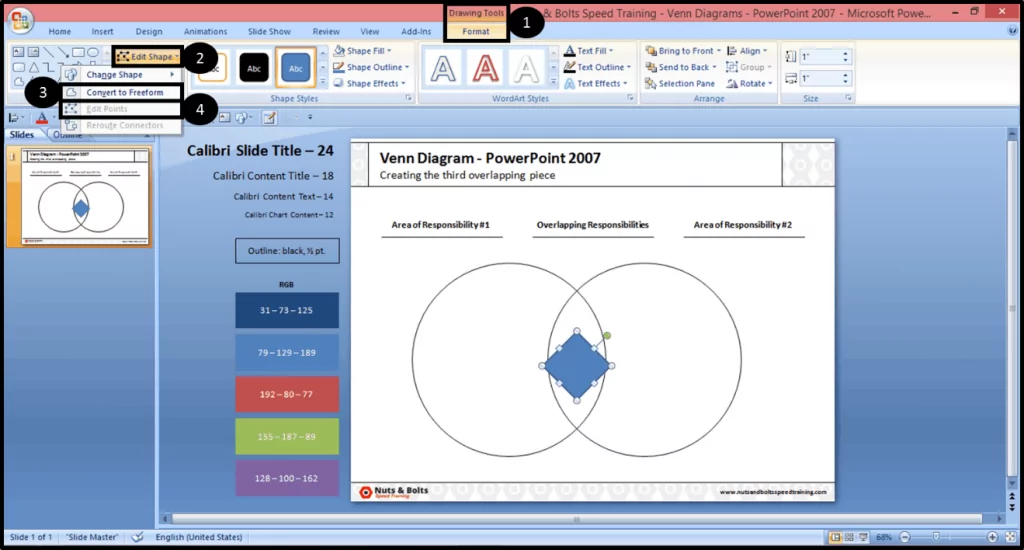
With the square now perfectly aligned in the middle of our shapes (which makes this easier), select the square again and then:
- Select the Drawing Tools Format tab
- Open up the Edit Shapes drop down
- Select Convert to Freeform (and then re-select the Edit Shapes dropdown)
- Re-Select the Edit Shapes Dropdown and this time select Edit Points
Doing so, you should see a red outline around your square, signifying that you are now in Point Editing Mode.
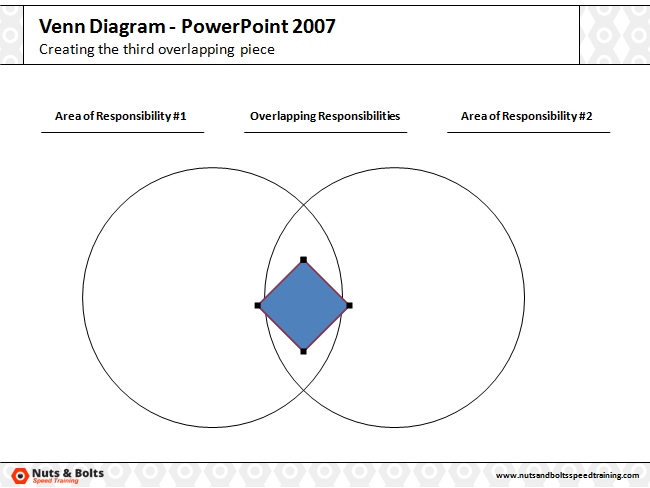
Grab the points and stretch them out to reach the top, bottom, left and right of the middle area.
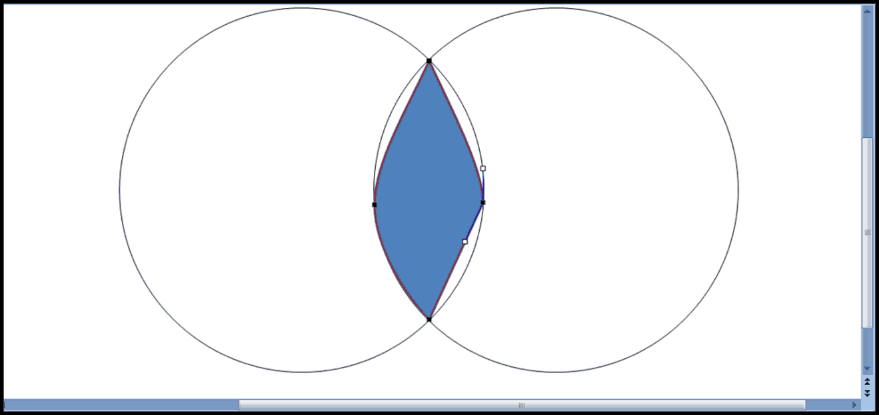
Note: This can only be done manually, there is no clever trick (that I know of) for doing this.
Selecting one of the points, notice that there are white handle bars that appear. You can use these to adjust and warp the edges of the shape.
Using the handle bars of the right and left points, warp the edges of the square until it fits perfectly the middle area of the Venn diagram.
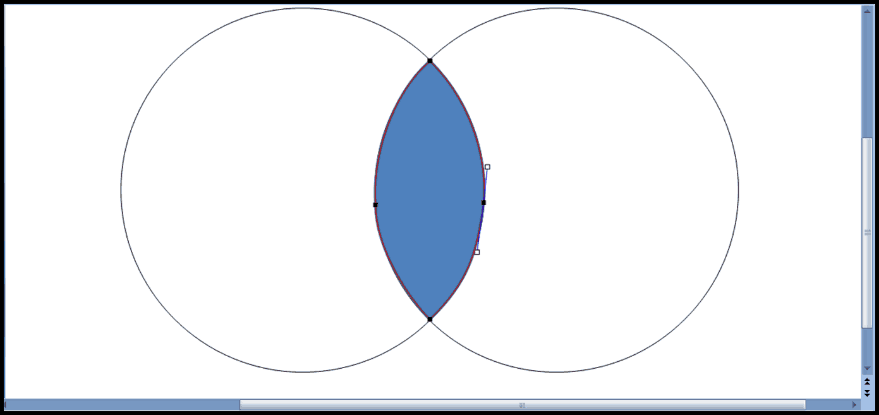
Note: This is horribly painful to pull off, and might take a little bit of time to get right. Be patient and/or upgrade your version of PowerPoint (it’s much easier in later versions).
With the new shape created, you can now color it and type text into the middle part of your Venn diagram.
Knowing that there is a Combine Shapes tool in PowerPoint 2010 and a Merge Shapes tool in PowerPoint 2013, it’s important to keep in mind that if you add the 2013 command to your QAT, and then open PowerPoint 2010 on your computer, the command will disappear.
Why?
Because PowerPoint 2010 doesn’t recognize the 2013 command. So you’ll need to either find a version of 2013 to use, or go and add the Combine Shapes tool to your QAT.
In the opposite scenario, if you add the PowerPoint 2010 Combine Shapes tool to your QAT and then open PowerPoint 2013 on your computer, the Combine Shapes tool will remain on your QAT, but it will not have the added features of the Merge Shapes tool. So if you want the Merge Shapes tool on your QAT, you need to add it specifically using 2013.
Conclusion
The easiest way to break your Venn diagram apart is with one of the later versions of PowerPoint, PowerPoint 2013 or later.
This is because you can now use the fragment tool to quickly break apart your Venn diagram, regardless of how many overlapping circles you have which you can see me do here.
If you enjoyed the depth of this tutorial, covering all versions of PowerPoint, you will LOVE our PowerPoint training courses which you can learn more about here.
What’s Next?
4 Weird Little PowerPoint Tricks Could Save You 40 Hours in PowerPoint this Year!
“I would have paid $500 for this information” – Sam Thatte

Discover 4 weird little PowerPoint tricks that will save you 40 hours of heartache and frustration in PowerPoint this year… as soon as you start using them. Join for free today.
I go a different route. I make a copy of the Venn Diagram on a separate slide, select both circles, then use the Intersect Shapes function which cuts out that middle piece. Then I copy that piece to the original slide. Perfect fit and takes little time.
Hi Charles! Absolutely, that’s a great suggestion, thanks for sharing it!